The RBA’s inflation targeting policy fails on performance and social justice grounds. The purported benefits of low inflation have not been forthcoming. An alternative approach to government policy should be considered as a means of achieving full employment with price stability.
Hyperinflation, high inflation and deflation are bad and low inflation is good. The Reserve Bank of Australia (RBA) tries to alter inflation with a simple policy tool, the official cash rate (OCR), whereas the economy is complex.
Cyclones Larry (2006) and Yasi (2011) damaged banana plantations, resulting in banana prices rising before returning to normal levels as supply recovered. Prices did not rise due to increased costs (cost-push inflation) or consumer demand exceeding productive capacity (demand-pull inflation). The wholesale market cleared (consumers substituted other fruits) and the productive capacity of the plantations had not changed, only output delayed while waiting for new plants to grow. Banana growers knew it would be again profitable to sell bananas at much lower prices than obtained with the cyclone induced supply, rather than start new businesses in the weather-related insurance industry.
The experience of banana consumers seems to suggest government policy is not required. This might be appropriate for a single product event (microeconomic), but this is not the reality for the entire economy (macroeconomic). The question is how does society choose appropriate economic policies that promote the welfare its members.
The main points are:
- Not all price increases are inflation.
- Monetary policy has no significant influence over the pricing decisions of businesses.
- Fiscal policy can be used to increase economic growth without causing inflation.
Measuring Price Changes
The Consumer Price Index (CPI) published by the Australian Bureau of Statistics (ABS) measures household price changes of 11 groups of consumer items. The CPI is the best available measure, not a perfect measure of inflation. For the individual consumer, the CPI is at best a price index of items that might be consumed.
The ABS has improved the CPI with annul re-weighting. Living Cost indices provide more relevant datasets for particular groups of consumers. Data for non-discretionary and discretionary spending supplement the CPI.
There are three versions of the quarterly CPI: All Groups, Trimmed Mean (TM), Weighted Mean. (The ABS identifiers are A2325846C, A3604509L and A3604503X.) For our purposes, the difference between each is the size of the increase or decrease (volatility) between consecutive periods: most volatile, less volatile, and least volatile. Unless otherwise stated the data below refers to the Trimmed Mean (quarter on corresponding quarter).
For the 164 quarters from June quarter 1983 to March quarter 2024:
- 43% of values have been within the RBA target range (2 to 3 per cent),
- 39% of values have been below 2.5 per cent in four periods longer than two quarters, starting in September quarter 1992 (for 11 quarters), June quarter 1997 (for 11 quarters), March quarter 2012 (for 7 quarters), and September 2014 (for 29 quarters), and
- there has not been any deflationary period (excluding the All Groups CPI for the 1997-98 Asian Financial Crisis and Covid in the June quarter of 2020).
Further, 60% of values were below 3 per cent, 18% were below 2 per cent, and 20% of values were above 6 per cent (including 3 quarters from September 2022, otherwise all before March quarter 1991).
From this data it is not unreasonable to conclude inflation in Australia tends to be below 2.5 per cent, high inflation (twice the RBA upper limit) and low inflation (below the lower limit) is unusual, and deflation is improbable.
Defining Inflation
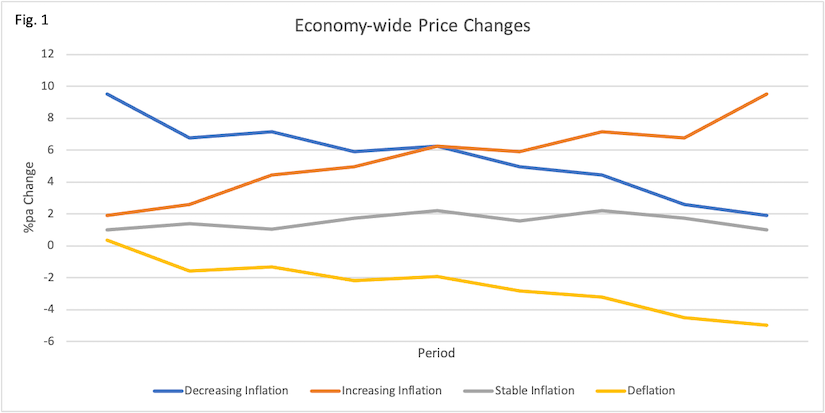
Inflation is a sustained economy wide increase in the price level. Very short periods of price rises are not inflation. Increasing (decreasing) inflation occurs when the price changes are accelerating (decelerating). Stable inflation occurs when price changes stay (about) the same. Deflation occurs when the price level falls and changes are negative. Figure 1 depicts these four types.
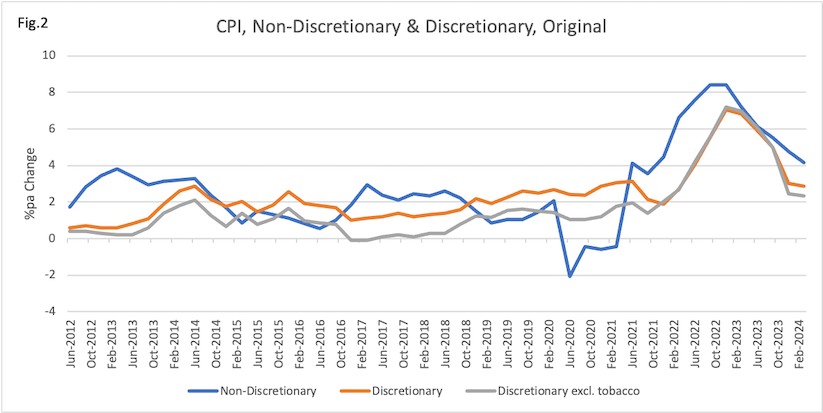
Being economy wide does not mean prices of all consumer items, or for each of the 11 CPI groups, change by the same amount. Figure 2 demonstrates that different categories of goods and services, in this case non-discretionary and discretionary items, can have different inflation rates. (The ABS identifiers are A124984971F, A124984980J and A124984989C.)
Sustained means that the causes of inflation continue. Decreasing (increasing) inflation suggests the factors that caused the initial inflation are becoming less effective (continuing to propagate). Inflation is difficult to identify if prices of some of the 11 groups go up and some do not, but the convention is to use the CPI total.
The initial causes of inflation are usually described as either due to increased costs (cost-push) or consumer demand exceeding productive capacity (demand-pull). Cost-push inflation cannot be sustained if there is no demand for the higher priced products. Therefore, distinguishing two types of inflation becomes less relevant to policy choices.
Saying, “Inflation continues to be high because of excess demand”, or “Inflation continues to be high because of increased costs”, misrepresents the underlying conditions.
Inflation Targeting
Trying to control inflation with changes in interest rates (monetary policy) is called inflation targeting.
The RBA does not control inflation (all price changes are caused by the RBA) or significantly influence inflation (price changes keep pace with changes in the OCR).1
The RBA established a target range of 2 to 3 per cent in the early 1990s and changes the OCR in an attempt to keep price changes within this target. The RBA policy is to “promote price stability, full employment, and prosperity and welfare of the Australian people.”
People prefer to hold and use money when it has a predictable value. (Periods of very high or hyperinflation are characterised by high demand for ‘real’ assets and alternative currencies.) Low inflation reassures consumers and producers the money they (expect to) hold has a known purchasing power (as income, saving, investment or profits).
The range of 2 to 3 per cent is meant to be low enough not to distort decisions, but high enough to avoid deflation — an economy-wide fall in prices. Monetary policy acting to keep inflation at 2 to 3 per cent is believed to encourage spending and therefore promote economic growth and reduced unemployment.
This belief downplays factors such as, a) consumers/businesses cannot equally increase income (or reduce saving, dissave, borrow) to support increased spending (production/investment), have dissimilar reactions to expected inflation, and have different perceptions of real interest rates, b) involuntary unemployment can exist during periods of economic growth, and c) the rate of economic growth can be due to influences that outweigh the effect of low inflation.2
The level and changes to the OCR are intended to ‘anchor’ inflation expectations. An increase in the cash rate indicates (you are meant to believe) inflation will fall in the future. A decrease in the cash rate indicates inflation is too low (or not likely to increase).
Because existing behaviour/arrangements cannot be rapidly altered, the changes in the OCR are believed/observed to have a lagged effect. Hence, the RBA has a tendency to increase and keep the OCR above the values for the most recent past, as long as inflation is outside the target range and/or not falling as fast as conjectured. Increasing (decreasing) interest rates cannot be used as a short-term policy to modify employment, wages or prices.
RBA statements about the inflation outlook usually includes comments similar to: a) the OCR must stay high or increase to prevent future inflation, b) the data does not give a clear indication, and c) there is or might be a need to lower the OCR, but not yet. Making guesses about the future movement of price and interest rate changes, known as future guidance, has in the past resulted in misleading and erroneous statements. Communication of monetary policy could be improved by being more discerning and direct.
Monetary policy is influenced by how much the current unemployment rates differs from the non-accelerating inflation rate of unemployment (NAIRU) — as a measure of how much spare capacity there is in the economy.
‘Natural’ or Equilibrium Rates of Unemployment
The non-accelerating inflation rate of unemployment describes the situation where inflation increases (decreases) when unemployment is below (above) a ‘natural’ rate. The NAIRU can only be estimated, with a large error, from existing data. RBA and Treasury calculate the NAIRU to be about 4.5 per cent. The NAIRU has no predictive value and can be disproved by observation.
The NAIRU is not measure of how much spare capacity there is in the economy. For spare capacity to exist there must have previously been (or could be in the future) employment at a higher or full capacity of the economy, which must have (will have) been the result of investment in productive capacity, which ‘naturally’ results in unemployment below the NAIRU. Productive capacity is dependent on capital investment and technological improvements increasing productivity, not the raw number of unemployed.
The NAIRU fails as a policy choice for two reasons, a) there must be a permanent pool of unemployed (a social justice failure), and b) there must be a reduction in economic growth (an economic efficiency failure). The efficiency failure results in actual economic growth falling below potential economic growth.
The RBA statement that low inflation promotes economic growth and reduces unemployment is logically inconsistent with the policy of creating and maintaining unemployment to achieve low inflation.
The United Nations (UN) recognises employment as a human right. Employment provides personal, social and economic benefits. Price stability is not a human right.
Macroequilibrium Rate of Unemployment
The macroequilibrium rate of unemployment (MRU) posits a trade-off between unemployment and inflation — lower unemployment results in higher inflation. The MRU moves as employment and price changes adjust to current economic conditions. Unemployment and inflation stabilise around new values through the effects of a structural imbalance in the labour market.
This structural imbalance manifests in the wage setting process having a bias towards the employed: simply put, unemployed have no influence over wages. The longer a person is unemployed the greater is their separation from the labour market. This structural imbalance increases (reduces) during periods of falling (increasing) economic growth and is therefore cyclical.
New entrants to the labour market, long-term unemployed, underemployed and casual employees are a pool of labour ‘acting’ to limit increases in nominal wages — if you don’t accept the wage offered someone else will. Therefore, nominal increases in wages obtained by the employed are constrained. Thus, unemployment could fall without significant effects on wage and price increases.
Employment Not Unemployment Policy
The MRU offers the potential for appropriate government policies to use an employment buffer (guaranteed employment at a socially acceptable minimum wage) as a means to moderate inflationary pressures (in the form of increased wage and price demands) by transferring labour from the higher wage private sector to the lower wage for the otherwise unemployed labour public sector.
The employment of labour not wanted by businesses being paid a non-competitive (socially acceptable minimum wage) wage can be used instead of unemployment to moderate inflation and maintain aggregate demand within the productive capacity of the economy. The employment buffer expenditure would be counter-cyclical to private sector employment, decreasing (increasing) with higher (lower) rates of economic growth — employed moving from (to) minimum wages to (from) higher wages as businesses increased (decreased) productive capacity.
Being counter-cyclical, the employment buffer would tend, and could be managed, to only employ unused real resources within the productive capacity of the economy.
Institution and Ideology
The RBA target range of 2 to 3 per cent is entirely ideological — formed by beliefs rather than an evidence based and critical discourse of economic theory. The target values have no theoretical or evidential basis.
Figure 3 shows inflation was below 2.5 per cent for 29 quarters between September quarter 2014 and September quarter 2021. Over this period the RBA decreased the OCR without any obvious impact on inflation.3
Between March quarter 2021 and March quarter 2022 inflation had risen from 1.1% to 3.7%, providing evidence of increasing inflation, and the OCR remained at 0.1%. (The RBA only made OCR decisions monthly at this time.) Only after inflation had breached the ideological value of 3 per cent did the RBA increase the OCR.
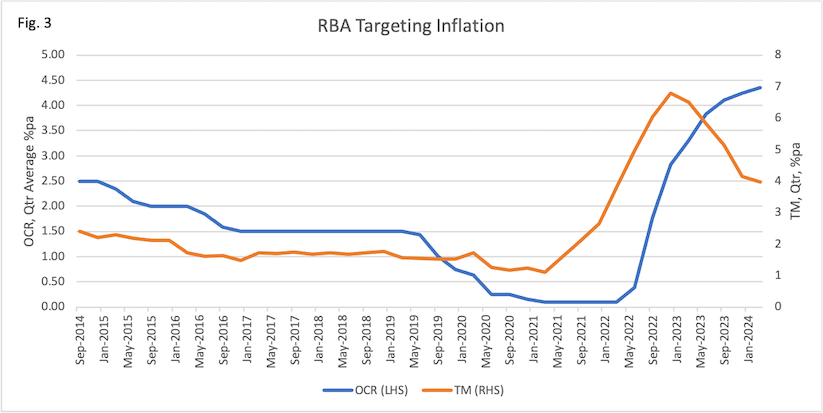
Increases in the OCR have continued after December quarter 2022, despite decreasing inflation. This is an institutional policy. An institutional policy is one chosen regardless of whether or not it is the appropriate policy needed to respond to a particular economic condition. In this case inflation is falling due to the initial cause abating (post Covid, special military operation supply shocks and climate change effects) and businesses adjusting to be in a position where the profits expected are obtained.4
Monetary policy allows no adjustment for differing effects on households with different demographic and economic characteristics, nor for the effective transfer of wealth between sectors (mortgagee, mortgagor, non-mortgaged), nor for how higher interest rates feed into higher prices. The RBA does not recognise that consumers make no causal contribution to higher prices through supply side shocks.
Setting aside the mortgagee-mortgagor contractual relationship: there is an awkward morality about a policy choice allowing a government organisation to redirect the mortgagor’s money to increase the profits of the mortgagee in order to increase unemployment being called a policy to promote the “prosperity and welfare of the Australian people”.
The institutional and ideological nature of the RBA’s pursuit of monetary policy can be summarised as: ‘If inflation increases (decreases) to be outside some arbitrary values put interest rates up (down)’.
Calculating Prices
Price setting decisions by businesses are best explained by a ‘mark-up’ model in a non-competitive (oligopoly) economy. No business is so small it cannot set prices: there are not such a large number of competitors every business must compete by having the lowest price.
This explanation allows for the intuitive assumption that a decision to change prices depends on whether there are or are not adverse effects on profits. The model enables a simple calculation to estimate profits and determine unit prices:
P = (1 + m) x (W × N) / Y
where P is the price of the output, m is the mark-up percentage and W is the wage cost, N is the number of employees and Y is the planned output. Fixed costs and net profit are paid from the gross mark-up.
A feature of this equation is the determination of real wages. For the employee, the nominal wage is deflated by consumer prices. For the business, the nominal wage is divided by the price received for its output, which depends on the particular business or industry and would not have exactly the same changes as consumer prices.
The real wage is determined by two different factors: the nominal wage and the price setting decisions of businesses. The profit share of the unit price relative to the wage share will be affected by changes to the mark-up percentage.
Businesses produce as much as they expect to sell and can adjust prices or the quantity of output (up to productive capacity) if they have decreasing (sell more than expected) or increasing inventories. In the short-term, part of net profit can be used to pay for increased costs associated with increases in output (overtime etc.) or fund price discounts to encourage sales, rather than trying to alter wage costs.
Other Influences on Prices
Consumers do not have perfect information and cannot always buy at the best available price. Thus, the price does not have to be the same for all customers. Different prices might be offered to new and existing customers. Regional price differences are additionally influenced by market size, transport and storage costs.
Seafood, fruit and vegetables are types of products where prices are market determined and can fluctuate depending on seasonal or other variations in supply and demand. Those businesses (e.g., providing services) not having the same type of variations in supply and demand would be more sensitive to rising (falling) input costs and expected profit in setting prices.
Prices change for institutional reasons. These can be legislated, such as annual changes to government fees and charges. They can be regulatory, such as for electricity and health insurance. They can be regular, such as a higher price for the new model of your favourite car (the CPI should include a quality adjustment) and annual changes to education costs. They can be seasonal, but this will be captured by seasonal adjustment of the CPI.
Prices change due to inflation. There is a distinction between, a) prices that are indexed to the CPI, but change for other reasons, and b) when inflation is used to justify price changes that would not otherwise occur.
Calculating Price Changes Per Annum
The annual percentage change in prices can be calculated for seasonally adjusted data only as if the most recent value continues over one year (quarter on last quarter annualised).
100 x ((1 + Qt – Qt-1) / Qt-1)4 – 1)
This equation has the advantage of ignoring all the past values that are no longer relevant to future price changes, but has the problem of making price changes seem volatile. The quarter on same (corresponding) quarter last year calculation reduces the volatility, but can only refer to past inflation and should not be used to refer to future inflation.
100 x (Qt – Qt-4) / Qt-4
Percentage changes can be distorted by the ‘base effect’, where the reference period has some fall or increase not consistent with other periods in the series.5
Summary
We have seen in the cyclone-banana example that every increase in price is not inflationary. The CPI does not measure inflation, but is the best available measure. The preferred version of the CPI is the Trimmed Mean, which has a lower volatility than the All Groups series. The limited ability consumers have to avoid paying higher prices for non-discretionary items means the effects of monetary policy are not evenly distributed. (Low income cohorts will experience higher inflation.)
Monetary policy promotes “price stability, full employment, and prosperity and welfare of the Australian people”, yet without having any significant influence over inflation and by promoting unemployment. Monetary policy does not consider all the factors influencing consumer and business behaviour. Using the NAIRU as a policy parameter fails on social justice and economic efficiency grounds.
Employment is a human right. Unemployment is a greater threat to society, through the loss of personal, social and economic benefits, than inflation. Government could use an employment policy within the productive capacity of the economy rather than an unemployment policy.
Price setting decisions by businesses are best explained by a ‘mark-up’ model in a non-competitive economy where consumers cannot buy at the best price. Businesses are in a better position to set prices based on their expected profits. Some price changes are unavoidable either by legislation or regulation, and other regular or seasonal reasons — such price changes are not economy wide and sustained.
Price changes per annum can be calculated two ways. Each method has its advantages, but only one can be used in the sense of referring to future inflation.
Conclusion
Government policy could be improved. The RBA method of inflation targeting through interest rates has reduced economic growth and maintained unemployment. The economy (GDP) is supressed by monetary policy ensuring persistant unemployment.
However, economic theory recognises fiscal policy can be used to generate full employment that does not exceed the real productive capacity of the economy or create inflationary pressure in the form of price and wage increases.
Society can choose appropriate economic policies that promote the welfare its members.
Sources
Australian Bureau of Statistics, Consumer Price Index, Australia. Retrieved from https://www.abs.gov.au/statistics/economy/price-indexes-and-inflation/consumer-price-index-australia
Reserve Bank of Australia, Australia’s Inflation Target. Retrieved from https://www.rba.gov.au/education/resources/explainers/australias-inflation-target.html
Reserve Bank of Australia, The Non-Accelerating Inflation Rate of Unemployment. Retrieved from https://www.rba.gov.au/education/resources/explainers/nairu.html
Australian Government, The Treasury (2021) Estimating the NAIRU in Australia. Retrieved from https://treasury.gov.au/publication/p2021-164397
United Nations (1948) United Nations Declaration of Human Rights. United Nations General Assembly, 10 December 1948, Retrieved from https://www.un.org/en/about-us/universal-declaration-of-human-rights
Federal Reserve Bank of Chicago, The Recent Steepening of Phillips Curves (Chicago Fed Letter No. 475, 2023). Retrieved from https://www.chicagofed.org/publications/chicago-fed-letter/2023/475
Tsiaplias, S., Wang, J., The Australian Economy in 2022–23: Inflation and Higher Interest Rates in a Post‐COVID‐19 World, The Australian Economic Review, vol. 56, no. 1, pp. 5-19, Retrieved from https://doi.org/10.1111/1467-8462.12475
Lieb, L., Schuffels, J. Inflation expectations and consumer spending: the role of household balance sheets, Empirical Economics 63, 2479–2512 (2022). Retrieved from https://doi.org/10.1007/s00181-022-02222-8
Mitchell, W., Wray, L.R. and Watts, M. (2019) Macroeconomics. London: Red Globe Press an imprint of Springer Nature Limited.
Keen, S. (2022). The New Economics: A Manifesto. Polity Press.
Endnotes
1. As reported in this article, [https://www.abc.net.au/news/2024-06-16/brian-redican-luci-ellis-different-ways-to-dampen-inflation/103980488], Brian Redican (chief economist at NSW Treasury Corporation, previously at Macquarie Bank, previously at The Reserve Bank of Australia) has said that the “central banks don’t have as much control over inflation as some people imagine.” As reported above, for the 164 quarters from June quarter 1983 to March quarter 2024, inflation was within the RBA target range 43% of the time — worse than tossing a coin.
2. This belief reduces consumer (business) behaviour without considering consumers (businesses) do not (cannot) behave or are affected the same way. Consumers might, 1) increase (decrease) current spending and decrease (increase) future spending, 2) acquire financial or real assets that can (cannot), due to their liquidity, be easily converted to spending, 3) obtain wage adjustments resulting in a low (or zero) net effect on real incomes. Consumers in low-income cohorts (with a higher average propensity to consume) typically experience higher, more volatile inflation, thus sectoral inequality is increased. Households with relatively high debt tend to use increases in income to reduce debt (a lower marginal propensity to consume). Creditors and debtors are affected by inflation differently. Effective demand might not be increased in a current period without affecting a future period. The benefits of GDP growth can be skewed to those members of society least affected (best able to benefit) from inflation.
3. As reported in this article [https://www.abc.net.au/news/2022-06-28/rba-inflation-pay-rises-wages-cap/101187466] the then RBA Governor Philip Lowe “said the bank was keen to see evidence of stronger wage growth”. The economic (wage) growth supposed to result from low inflation was not occurring.
4. As reported in this article [https://www.abc.net.au/news/2022-03-09/philip-lowe-warns-russia-ukraine-war-will-send-cause-inflation/100894240] the then RBA Governor Philip Lowe said, “The war in Ukraine and the sanctions against Russia have created a new supply shock that is pushing prices up, especially for commodities,” Dr Lowe said in a speech at the AFR Business Summit on Wednesday [9 March 2022].
“This new supply shock will extend the period of inflation being above central banks’ targets. This runs the risk that the low-inflation psychology that has characterised many advanced economies over the past two decades starts to shift. If so, the higher inflation would be more persistent and broad-based, and require a larger monetary policy response.”
In plain language, ‘If the RBA thinks everybody expects inflation the OCR will go up a lot.’ Dr Lowe doesn’t seem to notice that inflation over the past two decades might have been low due to a dearth of ‘special military operations’ and other shocks. [You can research the ‘great moderation’ for more.]
5. For example, the ABS monthly CPI value for May 2024 records -0.3 per cent (last quarter) and 4.0 per cent (same quarter) inflation, due to prices falling in May 2023 and May 2024. The relevant values (all groups seasonally adjusted) are reproduced here: 119.4 Apr-23, 118.9 May-23, 119.7 Jun-23, 120.0 Jul-23, 120.7 Aug-23, 121.4 Sep-23, 121.0 Oct-23, 121.4 Nov-23, 122.2 Dec-23, 121.8 Jan-24, 122.0 Feb-24, 122.8 Mar-24, 123.7 Apr-24, 123.6 May-24. Australian Bureau of Statistics (May 2024), Monthly Consumer Price Index Indicator, Retrieved from https://www.abs.gov.au/statistics/economy/price-indexes-and-inflation/monthly-consumer-price-index-indicator/may-2024.
About the author
Robert Bibo BEc GradCertMgt worked at the Australian Bureau of Statistics from 1985 to 2009 in the National Accounts and Labour Force teams.
Labels: monetary policy, fiscal policy, inflation, consumer price index, modern monetary theory, heterodox economics.